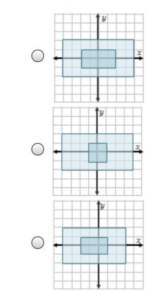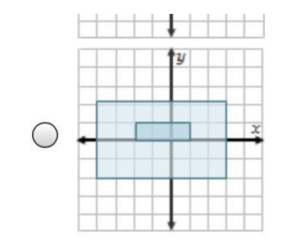

Answer:- The graph that displays a dilation between the specified graphs is; Graph 1.
Dilation in graphs indicates each side is increased by the same
scale factor. What this means is that the ratio of each dilated side to their
individual old sides beforehand dilation must be the comparable scale factor. First Graph; We can indicate it is a rectangle and the pre-dilated image has
2 units along the y – axis and 4 units across the x-axis. After dilation, it now
has 4 units along the y – axis and 8 units across the x-axis.